Hey everyone. Today I wanted to talk about memory usage during rendering, tips to keep it low and some areas of Blender that need love to avoid causing the memory to skyrocket. This post is actually inspired by the investigation work I’ve been doing over the weekend, looking into the memory consumption of the shot from the movie that involves a huge grass field. So it might be interesting for those who’re now trying to do their own grass scenes.
This is actually the most important aspect of today’s topic, so let’s get into it and review all the aspects.
While strands is the native approach for working with a character’s hair, since it allows all those neat features like combing, with its heavy use of physics, this approach is in general really memory hungry. This is because, while rendering, there’s no other method but to evaluate all the strands with their final resolution and final child count and keep them in memory. This already doesn’t sound really memory friendly, but what’s happening later is that every strand segment (note: a strand segment is a part of a strand that corresponds to single resolution step) is added to the BVH tree (note: the BVH tree is the bounding hierarchy tree, an optimization structure used by Cycles to speed up ray intersection checks).
The BVH tree by itself is relatively small compared to all the hi-res textures used in the shot, but what’s really important to know about the BVH tree is that the number of nodes in it directly affects render performance. Basically, more nodes means more steps to perform a ray-intersection query. And since there’s quite a few strands in the grass field, BVH will become really huge, making intersection checks quite slow.
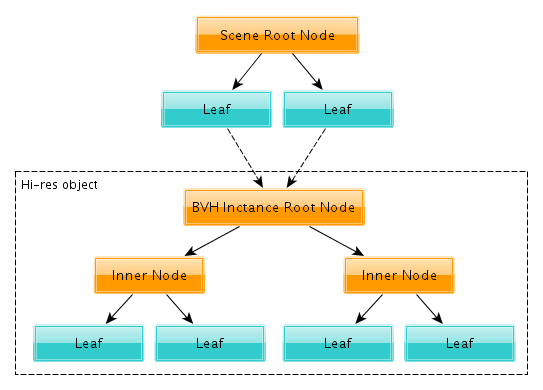
BVH tree created without instancing
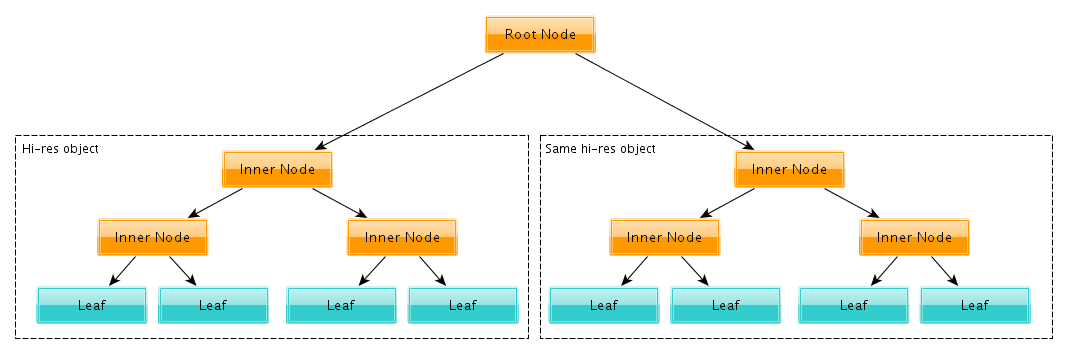
What this actually means is: the geometry that is being duplicated does have its own BVH tree, which then gets referenced from the main scene’s BVH tree. This is the very memory-efficient way of adding loads of the same hi-res meshes into your scene. This applies to all instancing: dupligroups, dupliverts, duplifaces, particles.
Scene BVH tree instancing object BVH tree from several leaves
But now you might be wondering: what about the render time? And the answer is: it’s quite complicated and totally depends on the scene layout, etc. Basically there’re two conflicting aspects here:
The first case is probably what’s usually happening, but I also saw some scenes where second case was a real issue. But I would think, in complex enough scenes, the first case is what’s happening most of the time.
So, as a conclusion to this section: use instancing wherever you can; it helps you save memory and will likely improve the performance of complex scenes as well.
I think this is actually worth separate section in this post, since I’ve noticed artists using this modifier in really complicated setups.
The issue with this modifier is that even though it mentions “instance” in the name, it has nothing to do with the BVH instancing we talked about above. What this modifier does is get coordinates of particles from the given particle system and copies the object to all those locations. (Well, it’s a bit more complicated because of rotation and all sorts of other jazz, but it just adds extra complexity without affecting the general behavior.) And what you end up with is a really hi-res mesh mesh, which has all the geometry simply copied as many times as the number of particles you have. And it’s real geometry, single mesh only, so there’s no hope of BVH instancing it.
So try to avoid this modifier as much as possible, especially when you need to instance complex geometry thousands of times.

Locked interface option
There’s an option on the render panel to lock the interface during rendering. This obscure-looking thing serves two purposes:
Even when this option is enabled, you can still browse the image (pan, zoom) and can for sure stop the rendering process with the Esc button. All the rest of the interface stays frozen.
Now, currently its memory savings are really conservative, meaning it might not give you as much memory savings as it could in theory — but we’ll be looking into making it more aggressive.
This is where the more technical part of the post starts, but I’ll try to keep it as simple as possible, so you don’t get too bored. :)
Basically, Blender performs quite a few memory-allocation and memory-free operations during its operation, especially when updating the scene for rendering. And, basically, memory fragmentation happens when you allocate loads of memory blocks and then free some of them. It’s possible that a freed memory block can be interleaved with still-allocated blocks. It’s not an issue unless the operating system decides not to fill in those freed blocks and allocates memory on the higher address instead. So what you end up with is a totally inefficient usage of the memory.
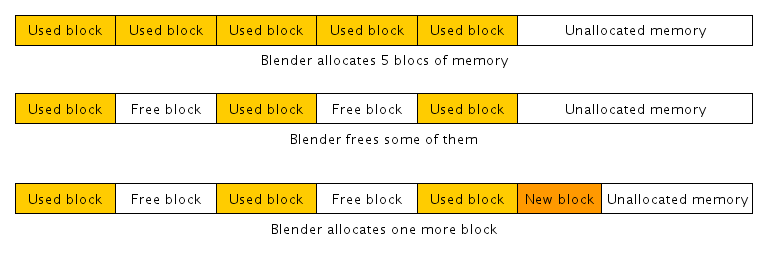
Memory fragmentation: note how the new block increases overall memory consumption
Fortunately, there’s the so-called jemalloc library, which is actually used by official Blender releases for Linux. This library basically hijacks memory allocation/free cells and implements them differently, and is much better at dealing with memory fragmentation.
This library hasn’t been tested with Blender on any other platform, so for now it’s only guaranteed to be a benefit on Linux.
First of all, derived mesh is an internal data structure that contains the final mesh geometry after all the modifiers are applied, etc. Actually, modifiers are applied to derived mesh already, but who cares. Just think of it as a data structure for the final hi-res mesh. :)
While rendering, the render pipeline will ensure the scene is in its actual state, invoking object updates when needed. This is mainly needed to make sure all the animation is nicely applied and object locations are known. But as a side effect, it’ll also create derived meshes for Viewport settings. This is basically caused by the legacy nature of the code and it’s not easy to solve because things like vertex parenting, shrinkwrap, and boolean are still operating with target’s object Viewport-derived mesh.
And those Viewport-derived meshes will stay in the memory for the whole rendering time. There’s nothing artists can do to control this and would need to be solved in the code.
You might think, ‘Oh well, a new dependency graph will solve this.’ But, unfortunately, it’s not a dependency graph issue; it’s the way the render pipeline interacts with it. Improvements are possible with the current dependency graph, and they doesn’t sound that bad, actually, from the quick tests.
Other than purely code-related issues, is the particle caching too much data? Once you’ve queried an object to update with the particle system, you’ll end up with several things in the memory:
There’s again coding work needed here; it’s a bit tricky but still pretty much solvable without major headaches.
For the time being, work for the OpenSubdiv integration is not finished. We’re using old code, which also has several issues:
There is also some crazy stuff happening in Cycles. Basically, the craziness is coming from the way Cycles exports objects from Blender:
But as it turns out the redundancy on the Cycles side is not really the cause of the issues with the grass field shot we were talking about before. So issues with Cycles memory usage need to be solved, but it’s not really a hotspot from the tests I’ve been doing here.
This post became much longer than I would have expected, so as a conclusion:
Anyway, hope you found this post useful! See you next time.
very usefull indeed
Absolutely usefull. Thanks a lot for all these informations, Sergey.
Thanks for the very informative summary!
Regarding your comment on the particle instance modifier: I would like to point out that I use it all the time, especially when I need to instance complex geometry thousands of times. That description fits perfectly as I use the particle instance modifier to generate a triangle for each dupliface instance I need. The geometry from the instance modifier is never rendered; it is only used to control the position, scale and rotation of each dupliface instance. This is one of the ways I get around the limitations of particle systems such as simple offsets and nesting.
Sounds like the particle instance modifier could be changed to generate a cached mesh of only vertices then use the duplivert code to instance the object on it.
That’s not so trivial, unfortunately. You can’t work-around nature of being a modifier this way. This is like the whole idea of this modifier to give real geometry, so you can then apply extra modifiers on top of it.
What is really needed is some extension of dupli-faces which would support scale and rotation randomization (and that randomization should be in total artists’ control).. That way you’ll have nice instancing, low memory consumption and grass field with much less visible patters comparing to regular dupli-face.
But one thing adds a bit more complexity — namely physics… So seems having instances for far plane and as minimal but still enough for good-looking physics real geometry is the way to go. Lukas is still investigating the ways to solve this particular issue tho, hopefully he’ll be reporting back soon :)
Awesome explanation!
Thank you for this!
There was some lengthy conversation about getting jemalloc to work on OSX in 2010. Seems it has been used on OSX and Windows.
https://bugzilla.mozilla.org/show_bug.cgi?id=414946
Also this.
http://article.gmane.org/gmane.comp.lib.jemalloc/930/match=
Yeah, Martijn Berger also reported this to me. he actually tried to do it on windows, poor guy :)
So think the way to go is to compare physical memory utilization after rendering the same file with the same exact version of blender on OSX/Win and Linux. If fragmentation wouldn’t be such an issue on those platforms then we can not go over all the hassle. If the fragmentation will be high enough… Oh well, let’s hope it wouldn’t be high :)
Nicely presented. You should write a book.
Thank you for all this info. It´s good to see that even with all this, blender runs better that some other commercial softwares.
I would like to know: Will the dependency graph fix some of this issues?